I analyzed 107,000 fourth-down decisions since 1999. The findings are troubling for NFL fans.
The Play That Changed Everything
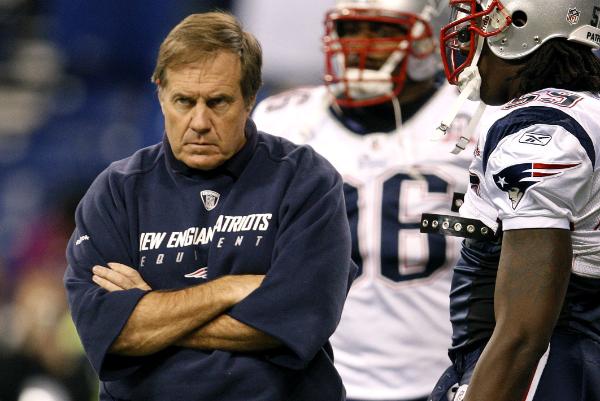
November 15, 2009. The New England Patriots lead the Indianapolis Colts 34-28. Two minutes and eight seconds remain. Peyton Manning — arguably the best quarterback in football at that moment — is standing on the sideline. The Patriots have the ball on their own 28-yard line. It is fourth and two.
Bill Belichick waves off the punter.
The decision is so unexpected that some Patriots players jog onto the field before being waved back. Tom Brady takes the snap and swings a short pass to Kevin Faulk, who catches it, gets driven backward, and is spotted one inch short of the first down marker. The Colts take over at the New England 29. Four plays later, Manning hits Reggie Wayne for a one-yard touchdown with 13 seconds left. Indianapolis wins 35-34.
The backlash was immediate and overwhelming. Rodney Harrison, a former Patriot turned NBC analyst, called it “the worst coaching decision I’ve ever seen Bill Belichick make.” ESPN ran columns. Talk radio spent days on it. The consensus was clear: Belichick had gambled, lost, and cost his team the game.
There was just one problem. He was right.
Win probability models — the same framework I used to build this analysis — show that going for it gave New England a 79% chance of winning. Punting would have dropped that to roughly 70%. Belichick took the higher-percentage path. Brady’s pass was caught. The spot was bad. The play failed. The decision didn’t.
This gap between outcome and decision value is central to this article. Its implications extend beyond one night in November.
What Win Probability Actually Measures
Before going further, it’s worth explaining the metric that drives this entire analysis: Win Probability Added (WPA).
At any moment in an NFL game, a win probability model calculates how likely a team is to win based on score, field position, down, distance, and time remaining. These models are trained on thousands of historical games, so when you’re up 7 with 4 minutes left on your own 40-yard line, the model can say — based on how similar situations have resolved historically — that you win about 82% of the time.
WPA simply measures how much a single play moves that needle:
WPA = Win Probability (after play) − Win Probability (before play)
A great conversion on 4th & 1 might add +0.08 WPA. A turnover on 4th & goal might cost −0.15 WPA. The number is always relative to what you had before.
For grading decisions specifically, I compute the gap between the optimal decision’s expected WPA and the actual decision’s expected WPA in a given game state. That gap — averaged across all of a coach’s decisions — is what I call the Decision Quality Score, or DQS. Lower is better.
| DQS (Decision Quality Score) | Average WPA gap between optimal call and actual call | Lower = better |
| ODR (Optimal Decision Rate) | % of plays where coach made the historically optimal call | Higher = better |
Before getting to the field map, one number sets the table. When NFL teams actually go for it on 4th down, how often do they convert?
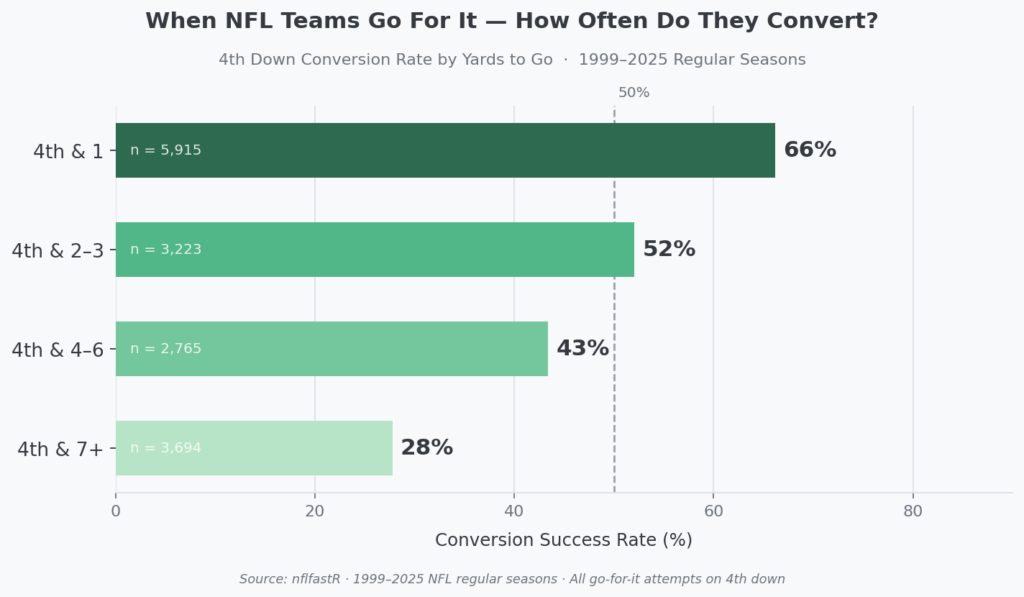
Two-thirds of the time on 4th & 1. More than half the time on 4th & 2–3. Even at medium distance — 4th & 4–6 — teams succeed on 43% of attempts, nearly coin-flip odds. These aren’t low-percentage gambles. They’re manageable probabilities that coaches have been systematically undervaluing. That’s the key to understanding why the WPA math works the way it does.
This analysis yields a field-position cheat sheet, with four versions based on yards-to-go categories:
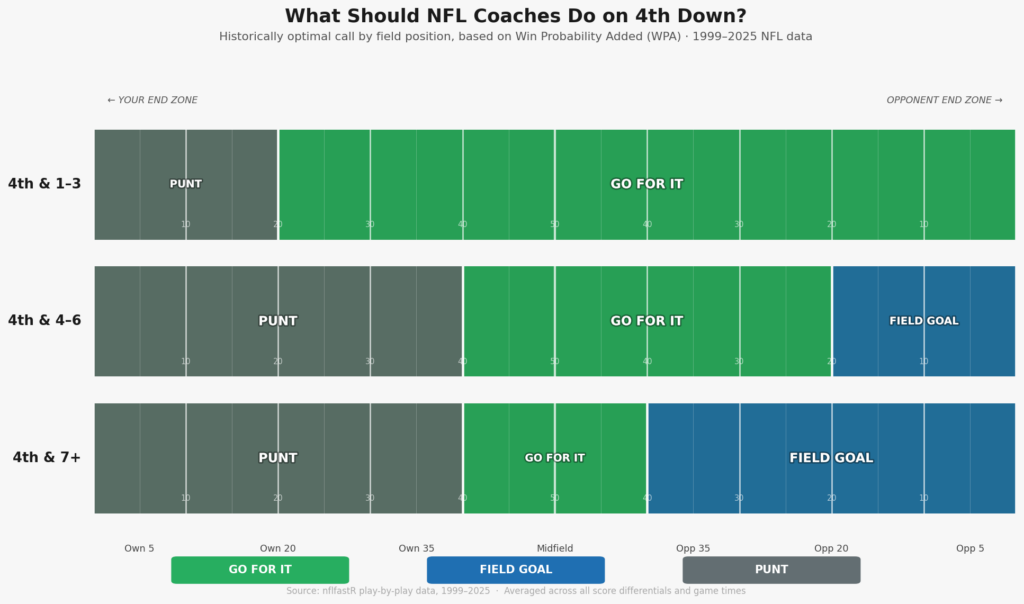
The green covers far more of the field than conventional wisdom would suggest. On 4th & 1–3, the data says go for it from your own 20-yard line all the way to the opponent’s end zone. On 4th & 4–6, the go zone still stretches from midfield to the opponent’s 20. Even on 4th & 7+, going for it is optimal at midfield — a call most coaches would never make. Most coaches aren’t operating anywhere close to this. The next two sections show exactly how far they’re missing.
The NFL’s Quiet Revolution — And Its Limits
Belichick’s fourth-and-two decision in 2009 didn’t just generate controversy. As Kevin Clark wrote in The Ringer in 2019, it started a conversation — one that analytics departments across the league had been waiting years to have. Teams began adding win-probability consultants. Front offices that had dismissed the math suddenly had a famous case study to point to.
But here is the part of the story that rarely gets told: the actual coaching behavior didn’t budge for nearly a decade. From 2009 through 2016, the league-wide go-for-it rate bounced between 12% and 13% — almost exactly where it had been in 2008. The conversation changed immediately. The calls didn’t. The real inflection came in 2017 and 2018, when the rate jumped from 13% to 18% over two seasons, driven by a new generation of coaches who had already adopted analytics. The play that supposedly changed the NFL took eight years to actually change how the NFL coached.
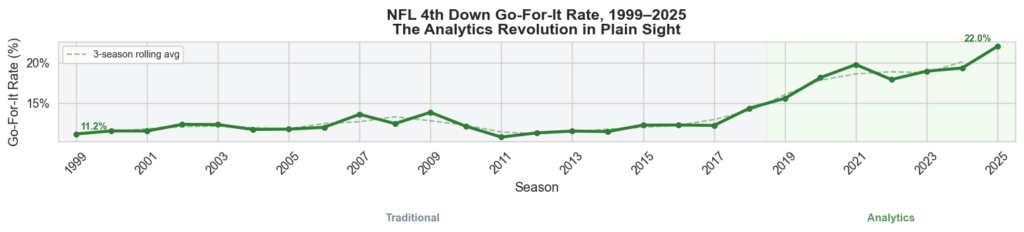
In 1999, NFL teams went for it on fourth down just 11.2% of the time. By 2025, that number had nearly doubled to 22.0%. That sounds like enormous progress — and in some ways it is. But consider what 22% actually means: coaches are still punting or kicking on more than three out of every four fourth downs. Given how often the data says they should be going for it, that conservative baseline tells a story about how deeply ingrained the old instincts remain.
Not every coach has resisted the shift. John Harbaugh set what Football Outsiders described as an all-time record for fourth-down aggressiveness in 2019, and was publicly celebrated by the analytics community for openly deploying win-probability models on game-day decisions. Across 17 seasons and 2,253 fourth-down decisions in my dataset, he ranks 27th out of 167 qualifying coaches — not because he goes for it constantly (his career go-for-it rate is 13.6%), but because he consistently picks the right spots. Ron Rivera — “Riverboat Ron,” a nickname earned after a string of aggressive fourth-down calls in 2013 — was one of the first coaches to publicly credit the NYT’s Fourth Down Bot for changing how he thought about the game, and ranks 37th in my analysis. In the current era, Dan Campbell has pushed it furthest: his Detroit Lions go for it on 28.4% of fourth downs, the highest rate among established head coaches in the analytics era. My analysis ranks him 9th out of 167 coaches, with a 73% optimal decision rate — the aggression isn’t reckless, it’s accurate. But Campbell and Harbaugh are outliers. The median coach still punts.
Average coach decision quality improved about 28% between 1999 and 2025. While this is progress, even today, coaches still make the wrong call on more than a quarter of fourth downs.
What Bad Decisions Actually Cost
Progress tells part of the story. The cost of imperfection tells the rest.
Each incorrect decision carries a WPA cost — the expected win probability that evaporates when a coach punts instead of going for it, or kicks a field goal in a situation where the data says go. Add those costs up across every fourth down in a season, and the number is striking.
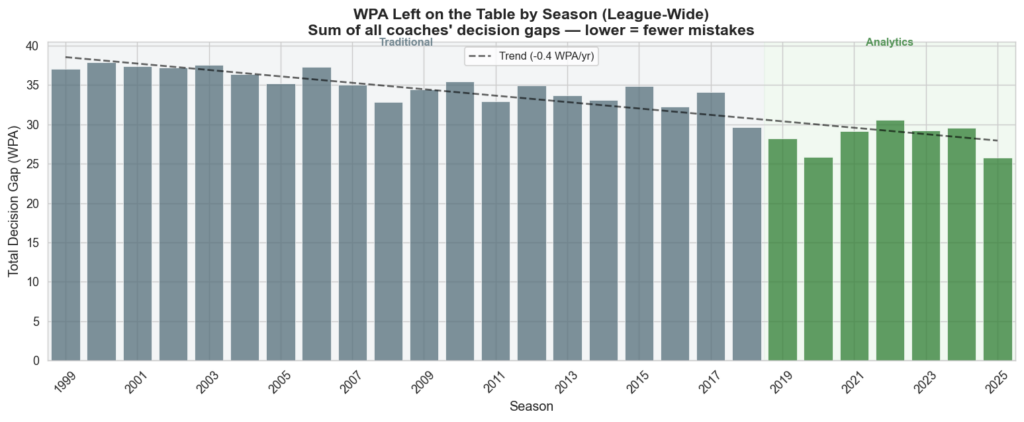
In 1999, NFL teams collectively left 37.1 WPA on the table in a single season from bad fourth-down calls alone. By 2025, that number had dropped to 25.7 WPA. Spread across 32 teams, that’s still roughly 0.8 WPA per team per season — the equivalent of nearly one free win, unclaimed, every year. That is the difference, in many cases, between a playoff berth and a missed one.
Improvement deserves recognition, but the gap persists. Coaches are more accurate in clear-cut situations, but the challenge lies in less obvious circumstances.
Where Coaches Go Wrong Most Often
The most mismanaged fourth-down situations are not the ones that feel risky. They’re the ones that feel safe — where decades of conventional wisdom have convinced coaches that the conservative call is obviously correct. The data says otherwise.
The wrong-call heatmap below shows where errors cluster across the entire field:
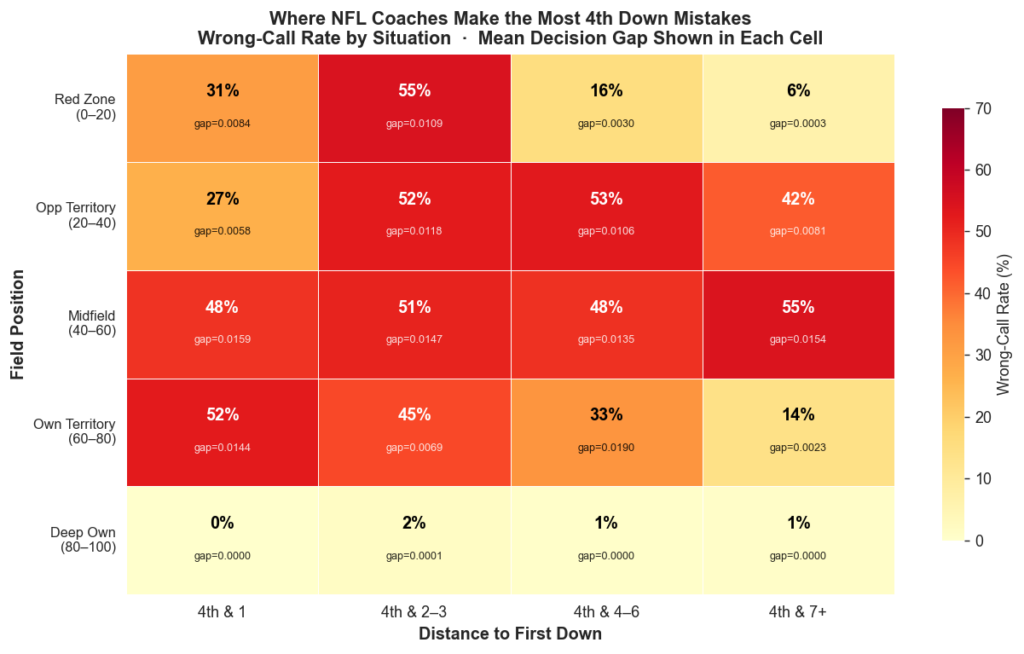
Strip away the percentages and the heatmap has only two modes: the situations coaches handle correctly, and everything else. One row of the map — deep in a team’s own territory, beyond the 80 — is almost entirely white, with a 0–2% wrong rate. That’s the row where the right call is obvious: punt. One corner, long fourth downs in the red zone, is also light. Kicking a field goal when you’re 7+ yards out at the goal line is fine.
Everywhere else, coaches are wrong roughly half the time. Midfield at any distance. 4th & 1 from your own 30. 4th & 2–3 in the red zone. 4th & 4–6 in opponent territory. These aren’t scattered hot spots — they are the majority of the field, sitting at 45–55% wrong-call rates that are visually indistinguishable from each other. Outside of the narrow band of “obviously punt” and “obviously kick,” NFL coaches are effectively coin-flipping the decision.
Two situations are worth singling out because they cut directly against entrenched conventional wisdom.
4th & 2–3 in the red zone (55% wrong-call rate). When a team faces fourth and short inside the opponent’s 20, coaches kick a field goal more than half the time even though going for it is the historically better decision. The logic is intuitive — you’re in scoring position, take the guaranteed points — but it misses a crucial asymmetry. Convert on 4th & 2 in the red zone and you’re likely scoring a touchdown, worth four more points than the field goal you left behind. Fail, and your opponent takes over inside their own 20 with no realistic path to immediate points. The WPA math consistently favors going for it. Coaches consistently don’t.
4th & 1 from your own side of the field (52% wrong-call rate). Fourth and inches from your own 30 or 40 is routinely treated as an automatic punt. It shouldn’t be. Conversion rates on 4th & 1 are roughly two-thirds league-wide, and a successful conversion extends a drive that is already in a neutral or slightly favorable field-position context. Punting trades a ~67% shot at keeping possession for the certainty of giving the ball back. Half the time, coaches take the certainty.
One pattern runs through all of it: once the situation leaves the “obvious” column, coaches systematically default to the conservative option. The field goal feels safe. The punt feels responsible. The numbers say both instincts, applied too broadly, are costing teams games.
Who’s Doing It Right
The flip side of the wrong-call story is the list of coaches who consistently get it right. When I ranked all 167 qualifying head coaches on decision quality, the names at the top weren’t necessarily the household ones.
Nick Sirianni ranks second. The Eagles’ head coach made the historically optimal call 76% of the time across 617 decisions — a higher accuracy rate than any coach typically associated with football wisdom. Matt LaFleur of the Packers ranks fourth. Sean McVay sits 21st overall, but his 2025 season ranks among the best individual coaching seasons in my 27-year dataset. Dan Campbell — already noted for his aggression — lands ninth, and his 2022 season with Detroit was similarly elite.
The single most surprising finding came from Andy Reid. In 1999, his first NFL head-coaching season, Reid went for it on fourth down just 5.6% of the time. By 2025, at age 67, his Chiefs went for it 24.2% of the time — more than four times his career starting point — with an optimal-decision rate of 79%. Reid rebuilt his coaching philosophy in public, season by season, and won three Super Bowls along the way. It’s the cleanest case study of late-career adaptation in the data.
And at the very top: the best single-season decision-quality mark in my entire dataset belongs to a head coach who had never held the job before. Brian Schottenheimer, in his rookie year as the Cowboys head coach in 2025, went for it on 29.5% of fourth downs with an optimal-decision rate of 82% across 105 qualifying decisions. Highest accuracy, nearly-highest aggression, zero prior head-coaching experience. It is one season — small sample, and he will have to prove it over time — but in 27 years of data, no rookie head coach has matched it.
I built a Coach Explorer that lets you sort and filter all 167 coaches by era, aggression, and decision quality. If you want to argue with the rankings, start there.
Tool loading slowly? Open in a new tab →
Explore It Yourself
The analysis above is built on historical averages, which is where it has to start. But fourth down is situational, and every game is different. I built a 4th Down Decision Calculator that takes any specific scenario — field position, yards to go, score, time remaining — and returns the historically optimal call, along with what real NFL coaches actually chose in that exact situation. If you want to start somewhere familiar, type in the Belichick scenario.
The second tool, a Decision Boundary Map powered by an XGBoost model trained on all 107,000 plays, visualizes optimal calls across every field position and yards-to-go combination simultaneously, updating in real time as you move the game-state sliders.
Tool loading slowly? Open in a new tab →
How I Built This
A note on methodology for the analytically curious.
The core of this analysis is a WPA baseline framework built on nflfastR play-by-play data covering every NFL regular season from 1999 to 2025 — approximately 107,000 fourth-down plays, after filtering for complete situational data.
Game state binning. Each play is assigned to a game-state bucket defined by four dimensions: field position (5 bins), yards to go (4 bins), score differential (7 bins), and time remaining (5 bins). This yields up to 700 unique game states, though many are sparsely populated. Buckets with fewer than 10 plays for a given decision type are excluded from the baseline to avoid noise-driven conclusions.
Recency weighting. Rather than treating all 26 seasons equally, each play is weighted by:
w = 0.85^(2025 − season)This means 2025 data carries full weight (w = 1.0), 2024 carries 0.85, 2020 carries ~0.44, and 1999 carries ~0.03. The decay factor of 0.85 was chosen to reflect the meaningful philosophical shift in coaching that began around 2010, while still preserving enough historical signal to make rare game states statistically stable.
Optimal decision labeling. Within each game-state bucket, I compute the weighted average WPA for each decision type. The decision with the highest weighted mean WPA is labeled optimal. Every play is then tagged with whether the actual decision matched the optimal label (made_optimal = True/False) and the gap between optimal WPA and actual WPA (decision_gap).
Coach grading. DQS is the mean decision_gap across all of a coach’s plays. ODR is the proportion of plays where made_optimal = True. Coaches with fewer than 50 qualifying decisions are excluded. Grades are assigned by head coach name rather than offensive coordinator, on the basis that head coaches set the fourth-down philosophy even when play-calling duties are delegated.
The ML model. The Decision Boundary Map uses three XGBoost regressors — one each for go-for-it, punt, and field goal — trained on a temporal split (1999–2023 training, 2024–2025 held out). Features are exact rather than binned: yardline_100, ydstogo, score_differential, game_seconds_remaining, and season_norm (season scaled 0–1 over the full range). The temporal split is critical: a random split would leak future play patterns into the training set, inflating apparent model performance.
All code, notebooks, and Streamlit apps are open source. 🔗 GitHub Repository
The Gap Is Closing. It Hasn’t Closed.
Belichick’s 4th & 2 in 2009 is remembered as a gamble that failed. The more accurate reading is that it was a correct decision that happened to produce a bad outcome — and that distinction matters.
Outcome-based thinking is how most coaches still operate. If you go for it and convert, the decision looks brilliant. If you fail, it looks reckless. But win probability doesn’t care about outcomes in isolation. It cares about expected value — what decision, made consistently across thousands of similar situations, produces the best results over time.
The league has moved meaningfully in the right direction since 2009. The go-for-it rate has nearly doubled. The average DQS has improved by 28%. The total WPA left on the table has fallen by roughly a third. That’s genuine progress, driven by a generation of coaches who grew up watching analytics departments gain influence in front offices.
But 25.7 WPA still disappears every season from suboptimal calls. Coaches still make the wrong decision on 4th & short in the red zone more than half the time. The most conservative coaches in the league still punt in situations where the math is unambiguous.
Belichick made the right call on a November Sunday in 2009. The league has had sixteen years to catch up. Most of it still hasn’t.
Data source: nflfastR via nflverse, 1999–2025 regular seasons. Full methodology and source code: github.com/shanethakkar/nfl-4th-down-analysis.